By Noxxxx from https://www.noxxxx.com/?post_type=post&p=1542
欢迎分享与聚合,尊重版权,可以联系授权
本文记录了一次排查本地网页加载速度异常慢的经历。
8 G Mac + Docker 环境下运行 WordPress ,本地打开站点首页耗时非常长,虽然怀疑是内存不足导致的,但是无凭无据纯属猜测。下面是我的一些分析记录:
环境配置:
- Mac Pro 8G
- Docker LAMP
- PHP 7.x
- MySQL 5.5.62
- WordPress 5.5.1
通过下图可以发现 TTFB 的时间非常长
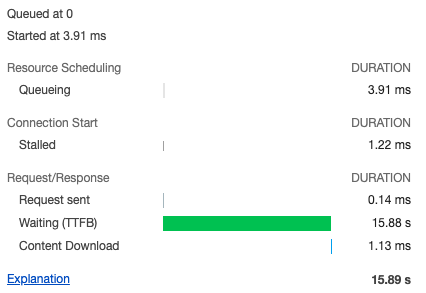
意味着可以先排除浏览器的问题,CSS DOM Js 解析相关的事情都可以放一边,从服务器,PHP 语言入手。
1. 先从 WordPress 入手
通过下面的代码,可以看到 WordPress SQL 查询次数,耗时,内存信息。
function performance( $visible = false ) {
    $stat = sprintf(  '<div style="text-align:center;">数据查询次数:%d 消耗时间:%.3f 秒, 使用内存: %.2fMB</div>',
        get_num_queries(),
        timer_stop( 0, 3 ),
        memory_get_peak_usage() / 1024 / 1024
    );
    echo $visible ? $stat : "{$stat}" ;
}
add_action( 'wp_footer', 'performance', 20 );
除了这个,还可以通过如下方式,看到具体每个页面涉及到的 SQL 查询语句的耗时。
<?php
    global $wpdb;
    echo "<pre>";
    print_r($wpdb->queries);
    echo "</pre>";
 ?>
未开启浏览器的「禁用缓存」的情况下,速度马马虎虎,不算很慢。
数据查询次数:31 消耗时间:0.808 秒, 使用内存: 22.81MB但是如果切换「禁用缓存」选项,就会命中耗时很长的请求。
数据查询次数:33 消耗时间:16.147 秒, 使用内存: 22.94MB但是从打印出的 SQL 语句的耗时来看,又是非常短,查询 MySQL 都是毫秒级的。
 [22] => Array
        (
            [0] => SELECT t.*, tt.* FROM wp_terms AS t INNER JOIN wp_term_taxonomy AS tt ON t.term_id = tt.term_id WHERE t.term_id = 7
            [1] => 0.00028514862060547
            [2] => require('wp-blog-header.php'), require_once('wp-includes/template-loader.php'), include('/themes/xx/index.php'), get_cat_name, get_term, WP_Term::get_instance
            [3] => 1602385752.2211
            [4] => Array
                (
                )

        )

    [23] => Array
        (
            [0] => SELECT  t.*, tt.* FROM wp_terms AS t  INNER JOIN wp_term_taxonomy AS tt ON t.term_id = tt.term_id WHERE tt.taxonomy IN ('category') AND t.term_id IN ( 15,17,16,3 ) ORDER BY t.term_order ASC
            [1] => 0.00058794021606445
            [2] => require('wp-blog-header.php'), require_once('wp-includes/template-loader.php'), include('/themes/xx/index.php'), get_post_by_category, get_posts, WP_Query->query, WP_Query->get_posts, WP_Tax_Query->get_sql, WP_Tax_Query->get_sql_clauses, WP_Tax_Query->get_sql_for_query, WP_Tax_Query->get_sql_for_clause, WP_Tax_Query->clean_query, WP_Tax_Query->transform_query, WP_Term_Query->query, WP_Term_Query->get_terms
            [3] => 1602385752.2216
            [4] => Array
                (
                )

        )
2. Nginx 获取链路耗时
通过配置 $request_time 和 $upstream_response_time $upstream_header_time
log_format main  '$remote_addr - $remote_user [$time_local] "$request" '
                     '$status $body_bytes_sent "$http_referer" '
                     '"$http_user_agent" "$http_x_forwarded_for"'
'"$request_time" "$upstream_response_time" "$upstream_header_time"';$request_time: 1.接收请求数据 2.将数据交给后端并处理 3.将处理结果发出 三者累计的耗时
$upstream_response_time:1.将数据交给后端并处理 2.将处理结果发出 二者累计的时间,因此这个时间肯定是小于$request_time
$upstream_header_time: 接收到后端服务器响应头花费的时间

可以看到,是 PHP-FPM 的耗时在 16 秒以上。
3. 开启 PHP 慢日志
由于我是使用 docker-compose 的方式启动容器的,因此只要在 docker-compose.yml 中添加 cap_add 和日志路径映射:
 volumes:
      - ./logs:/home/php_logs
 cap_add:
      - SYS_PTRACE
zz-docker.conf 添加慢日志开启语句:
;开启慢日志
catch_workers_output = yes
slowlog = /home/php_logs/$pool.log.slow
request_slowlog_timeout = 1s
通过上面的配置,可以拿到执行耗时超过 1s 的 PHP 语句记录。
[0x00007fd6eb617ae0] wp_remote_post() /var/www/html/local.xxx.com/wp-includes/cron.php:729
[0x00007fd6eb617690] spawn_cron() /var/www/html/local.xxx.com/wp-includes/cron.php:774
[0x00007fd6eb617350] wp_cron() /var/www/html/local.xxx.com/wp-includes/class-wp-hook.php:287
[0x00007fd6eb616fc0] apply_filters() /var/www/html/local.xxx.com/wp-includes/class-wp-hook.php:311
[0x00007fd6eb616f10] do_action() /var/www/html/local.xxx.com/wp-includes/plugin.php:478
[0x00007fd6eb616c30] do_action() /var/www/html/local.xxx.com/wp-settings.php:546
[0x00007fd6eb613890] [INCLUDE_OR_EVAL]() /var/www/html/local.xxx.com/wp-config.php:93
[0x00007fd6eb613700] [INCLUDE_OR_EVAL]() /var/www/html/local.xxx.com/wp-load.php:37
[0x00007fd6eb613190] [INCLUDE_OR_EVAL]() /var/www/html/local.xxx.com/wp-blog-header.php:13
[0x00007fd6eb613090] [INCLUDE_OR_EVAL]() /var/www/html/local.xxx.com/index.php:17
貌似我可以通过分析 WordPress 源码里的语句来分析为什么网站打开速度慢,但是,慢日志里的记录并没有主题代码的记录,也就是说去改动 WordPress 源码来解决本地访问速度慢的问题是不可靠的,因为 WordPress 升级后这些改动可能会失效…,这个思路是不推荐的。
到这个阶段,从 WordPress 打印出的 SQL 语句执行耗时,结合 Nginx 日志 + PHP 慢日志可以得出一个结论: WordPress 主题里的 PHP 代码和网站打开速度慢没有直接关联。
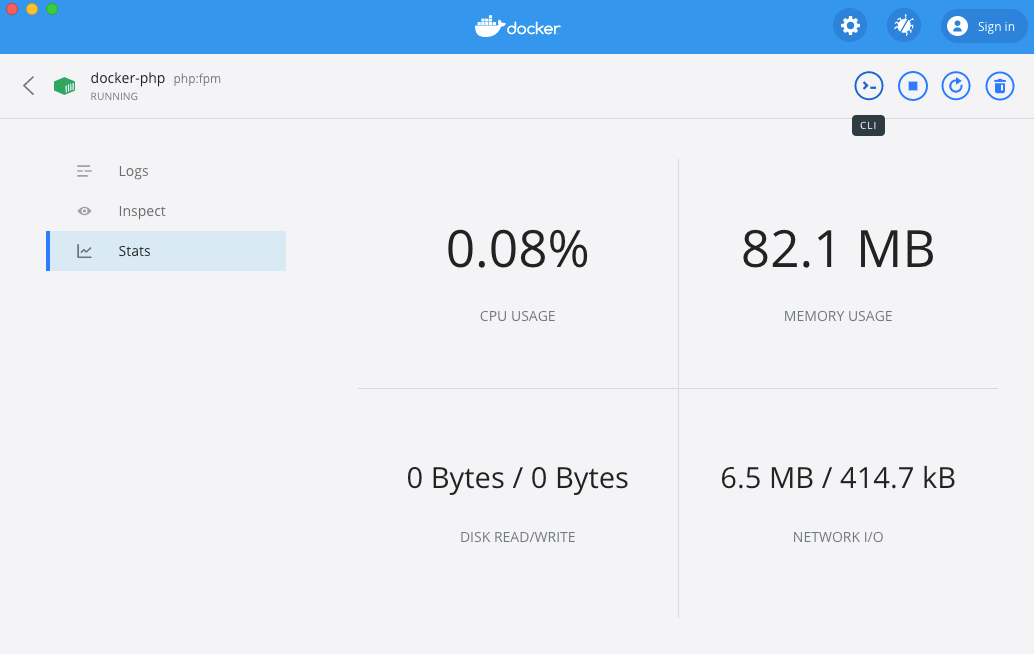
4. 容器限制
刚开始也有这一步的猜想,是不是因为 docker 容器限制了内存、CPU 导致的。观察了请求发出后 php-fpm 容器的性能情况,负载几乎可以忽略。
5. 内存不足
经过对比刚开机仅运行 Docker 容器访问站点和使用一段时间开启了多个其他软件再访问站点获得相应速度来看,可以判定是系统内存不足导致的。
给自己挖一个坑,还没有相关的知识储备来解释,为什么内存不足,软件就会卡
待续….