By Noxxxx from https://www.noxxxx.com/?post_type=post&p=1091
欢迎分享与聚合,尊重版权,可以联系授权
当我们谈及前端性能的时候,我们究竟想聊什么?
最近在做前端性能监控的一些事,这篇文章算是前端性能方面的基础知识梳理。
主要对 W3C 工作小组提出的各个草案和标准做了一些解读,各个草案的时间点,以及关注的内容等。
以往说到性能优化大家会认为是网页加载速度的快与慢,其实性能的好与坏也可以约等于用户使用的效率,同样的下面这些:
- 页面滚动是否平滑
- 点击按钮后响应是否够快
- 动画是否流畅,
- 关键内容是否优先被加载(参考 YouTube)
- webview 启动时间是否够短
- 更低的资源消耗( cpu 、电量等等)
也都可以是衡量一个网页性能的指标,当然还会有更多。
如何监控?
Synthetic Monitoring:合成监控
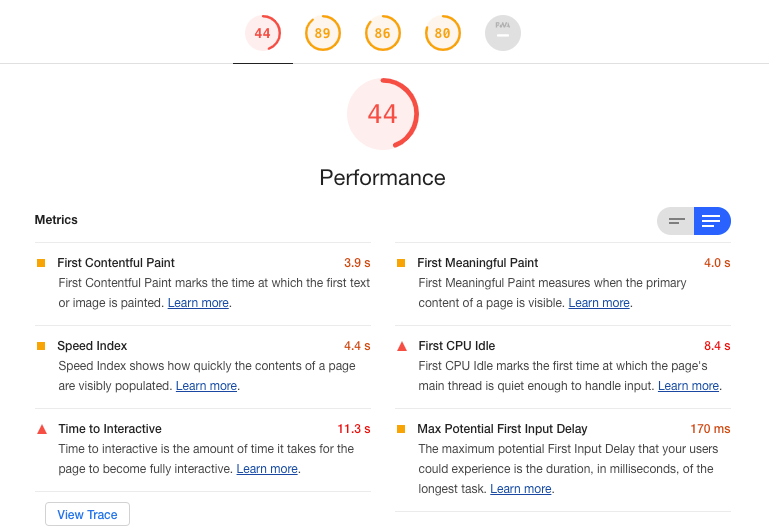
合成监控是指在模拟环境中的监控,通常我们自己使用 Lighthouse 去跑一个页面,生成的性能报告就可以认为是合成监控。
优点:
- 实现简单
- 采集到的数据维度更高,包括硬件的
- 对用户无影响
- 能够生成丰富的图标信息,瀑布图
缺点:
- 无法还原现实场景
- 样本数据无法代表现实情况
Real User Monitoring:真实用户监控 (RUM)
优点:
- 真实场景反映
- 数据量大,衡量价值高
缺点:
- 可视化过程需要处理
- 影响用户流量
- 没有 Native 帮助的话,采集信息有限
window.performance
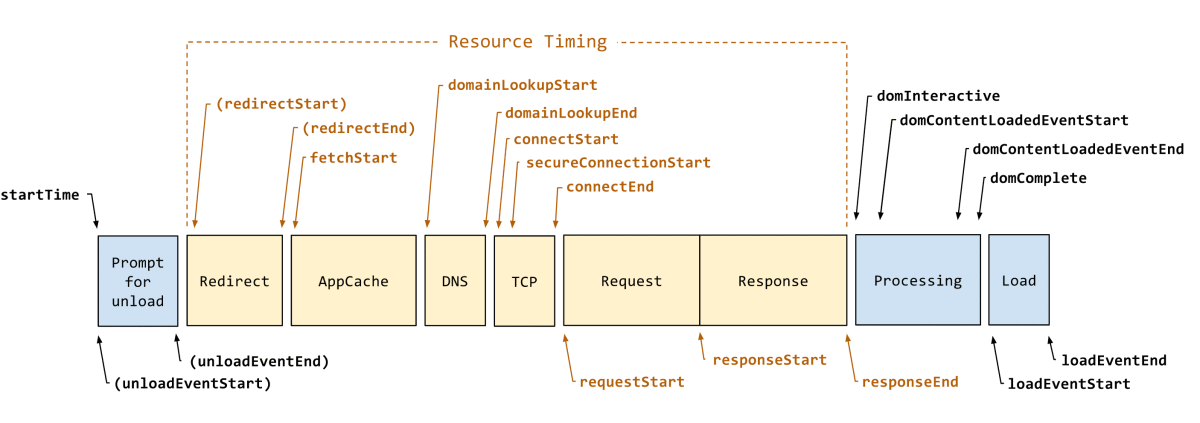
2012 年 W3C 就提出了这个 API ,可以获取到 DNS、请求响应相关的时间信息,这一版的标准中只是让开发者可以看到文档的一些性能指标,并没有太多的其他扩充。
interface PerformanceTiming {
  readonly attribute unsigned long long navigationStart;
  readonly attribute unsigned long long unloadEventStart;
  readonly attribute unsigned long long unloadEventEnd;
  readonly attribute unsigned long long redirectStart;
  readonly attribute unsigned long long redirectEnd;
  readonly attribute unsigned long long fetchStart;
  readonly attribute unsigned long long domainLookupStart;
  readonly attribute unsigned long long domainLookupEnd;
  readonly attribute unsigned long long connectStart;
  readonly attribute unsigned long long connectEnd;
  readonly attribute unsigned long long secureConnectionStart;
  readonly attribute unsigned long long requestStart;
  readonly attribute unsigned long long responseStart;
  readonly attribute unsigned long long responseEnd;
  readonly attribute unsigned long long domLoading;
  readonly attribute unsigned long long domInteractive;
  readonly attribute unsigned long long domContentLoadedEventStart;
  readonly attribute unsigned long long domContentLoadedEventEnd;
  readonly attribute unsigned long long domComplete;
  readonly attribute unsigned long long loadEventStart;
  readonly attribute unsigned long long loadEventEnd;
};
后面催生的 High Resolution Time Level 2 的提案,主要用来解决下面两个问题
- 时间精度不够
- 时间会被系统时间所影响
High Resolution Time Level 2
这里提出了使用高精度,并且不受系统时钟影响,单调递增的时间戳方案。
The time origin timestamp and the value returned by
Date.now()executed at “zero time” can differ because the former is recorded with respect to a global monotonic clock that is not subject to system and user clock adjustments, clock skew, and so on—see § 6. Monotonic Clock.
Time Origin
顾名思义,用来表明时间的起始位置
- 通常情况下,性能测试开始的时间
Performance Timeline Level 2
1. Extends the base definition of the Performance interface defined by [HR-TIME-2];
2. ExposesPerformanceEntryin Web Workers [WORKERS];
3. Adds support for performance observers.
Level 2 里面主要有三方面的改进,上述引用的是文档中的表述,其实扩充的内容比较多的,有下面几点:
[NAVIGATION-TIMING-2]
- 支持更高精度的时间,可以获取微秒,后续其他的 API 中跟时间相关的都可以基于此精度
- 支持 prerender 类型
- 支持获取重定向次数
- 支持获取网络协议
- 支持获取 transfer,encoded body 和 decoded body 的大小信息
原先我们使用 performance.timing 获取关于文档加载的一些性能参数,后续则可以通过 performance.getEntriesByType(“navigation”) 的方式来获取,里面的属性更多,涵盖维度更广。
> performance.timing
connectEnd: 1567256944074
connectStart: 1567256943782
domComplete: 1567256949276
domContentLoadedEventEnd: 1567256946155
domContentLoadedEventStart: 1567256946153
domInteractive: 1567256946153
domLoading: 1567256944385
domainLookupEnd: 1567256943782
domainLookupStart: 1567256943782
fetchStart: 1567256943026
loadEventEnd: 1567256949276
loadEventStart: 1567256949276
navigationStart: 1567256937982
redirectEnd: 0
redirectStart: 0
requestStart: 1567256944074
responseEnd: 1567256944376
responseStart: 1567256944373
secureConnectionStart: 1567256943911
unloadEventEnd: 0
unloadEventStart: 0
> performance.getEntriesByType('navigation')
PerformanceNavigationTiming
connectEnd: 6092.405000003055
connectStart: 5800.129999988712
decodedBodySize: 6869
domComplete: 11294.3250000244
domContentLoadedEventEnd: 8173.379999992903
domContentLoadedEventStart: 8171.450000023469
domInteractive: 8171.005000011064
domainLookupEnd: 5800.129999988712
domainLookupStart: 5800.1100000110455
duration: 11294.35999999987
encodedBodySize: 2671
entryType: "navigation"
fetchStart: 5044.319999986328
initiatorType: "navigation"
loadEventEnd: 11294.35999999987
loadEventStart: 11294.340000022203
name: "https://prismjs.com/test.html#language=javascript"
nextHopProtocol: "h2"
redirectCount: 0
redirectEnd: 0
redirectStart: 0
requestStart: 6092.624999990221
responseEnd: 6393.915000022389
responseStart: 6391.26500004204
secureConnectionStart: 0
serverTiming: []
startTime: 0
transferSize: 237
type: "navigate"
unloadEventEnd: 0
unloadEventStart: 0
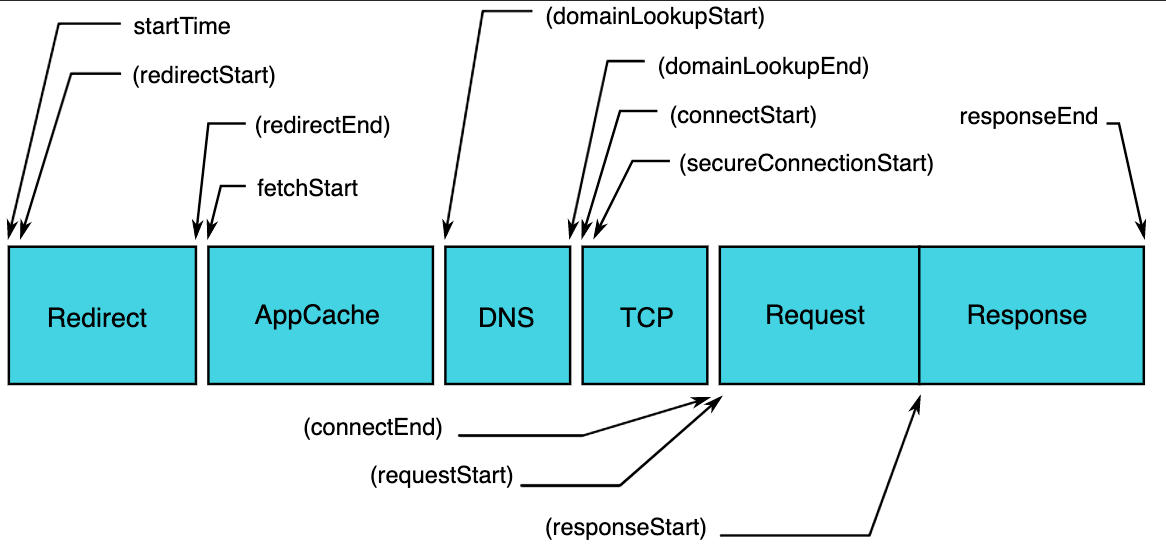
workerStart: 0关于性能 API 各个时间节点的最新示意图
[RESOURCE-TIMING-2]
Resource-Timing-2 支持获取文档中资源加载情况,包括图片,XHR 请求,iframe,script,embed,link,样式,svg。
注意点:
- 同一个 URL 出现在图片元素的 src 中,由于浏览器不会重复请求两个同样的文件(从缓存中读取),所以最终你只会获得一条关于这个图片资源的性能数据
- 如果使用 JS 去改变原始图片的 src 内容,原先请求的资源和被修改的资源都会被记录
- 对于 iframe 而言,如果一开始设置 src 为空,等到后面再通过脚本动态修改 src,那么浏览器将会对这条请求做记录。
- 一个链接发送了两次 XMLHttpRequest 请求,也会被记录下来
- iframe 嵌套 iframe 的情况,只会保存父节点的 iframe src 的性能记录,子 iframe 的将会被保存在父容器 iframe 下面,也就是说不存在跨 iframe 之间的记录
- 如果 IMG 标签里 src 使用 base64 的图片,就不会记录这个请求,因为不存在资源请求
- 如果资源请求失败(DNS,TCP,TLS错误导致),浏览器可能会记录,并且指出失败的具体原因,具体实现因浏览器而异,W3C 文档中使用了 May ,意味着并未对浏览器厂商做强制要求
- 跨域资源请求也会被记录
[USER-TIMING-2]
通过赋予开发者获取高精度的时间戳来衡量应用的性能,具体怎么赋予的呢?
- 支持
PerformanceMark和PerformanceMeasure两个 API 在 Web Worker 中使用
如何在代码中衡量性能?
async function run() {
  performance.mark("startTask1");
  await doTask1(); // Some developer code
  performance.mark("endTask1");

  performance.mark("startTask2");
  await doTask2(); // Some developer code
  performance.mark("endTask2");

  // Log them out
  const entries = performance.getEntriesByType("mark");
  for (const entry of entries) {
    console.table(entry.toJSON());
  }
}
run();
PerformanceObserver
这个 API 将是日后 W3C 所推荐的,衡量性能的方式
相关阅读:
https://developer.mozilla.org/en-US/docs/Web/Performance
https://developer.mozilla.org/en-US/docs/Web/Performance/Navigation_and_resource_timings
https://www.w3.org/TR/2013/REC-performance-timeline-20131212/
https://github.com/w3c/web-performance#specifications
https://www.w3.org/TR/navigation-timing/#sec-navigation-timing
https://docs.google.com/spreadsheets/d/e/2PACX-1vQAriyZXd_UfwJ0ptBlGn4qp7rSIa1u5yiaHKthOVSHuXE4bwheTS3EXgUcu5308PIsii5la6PEll9Z/pubhtml?gid=0&single=true
https://www.w3.org/TR/performance-timeline-2/